FinSents - Help
Introduction
Welcome to FinSentS Free Portal. For your better experience, please go through the help document.
Indicator Descriptions
Sentiment Score: A measure of the bullishness / bearishness of the language used in media coverage of a given stock on a given day. Ranges from -5 (extremely negative coverage) to +5 (extremely positive coverage); a score of 0 indicates an absence of articles for that day.
Alternatively, scores may also be expressed on a 0 to 10 scale with 0 still indicating an absence of articles for that day, 1,2,3 a negative score, 4,5,6,7 a neutral score, and 8,9,10 a positive score.
The overall sentiment score is computed as a weighted average of sentiment scores over news titles, headers and company specific phrases. A significant correlation between news sentiment and stock prices is observed across most listings.
Sentiment High: The intraday maximum value of the sentiment score, polled at 5-minute intervals.
Sentiment Low: The intraday minimum value of the sentiment score, polled at 5-minute intervals.
News Volume: The number of news articles about this stock, published and parsed on a given day. Volume of news provides a good indicator of a trend breakout or a trend reversal.
News Buzz: A measure of the rate of change in news coverage of a given stock on a given day, normalized on a scale of 1 to 10. The buzz score measures the change in the standard deviation of periodic news volume. It can be thought of as the "rate of change of news"; it thus serves as a risk alert indicator.
Home
This is the home page of FinSentS Free Portal.
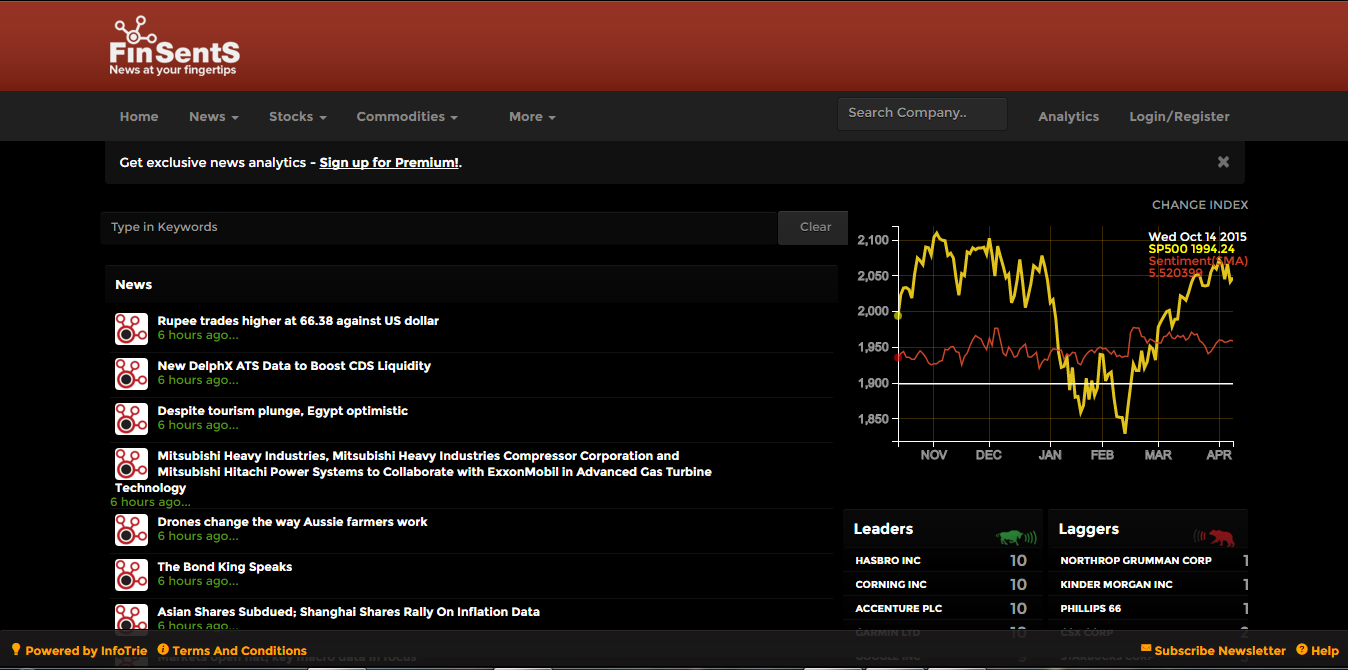
1. News Circles
At the top, you will find different news circle menus.

2. Search Company
Search your favorite company

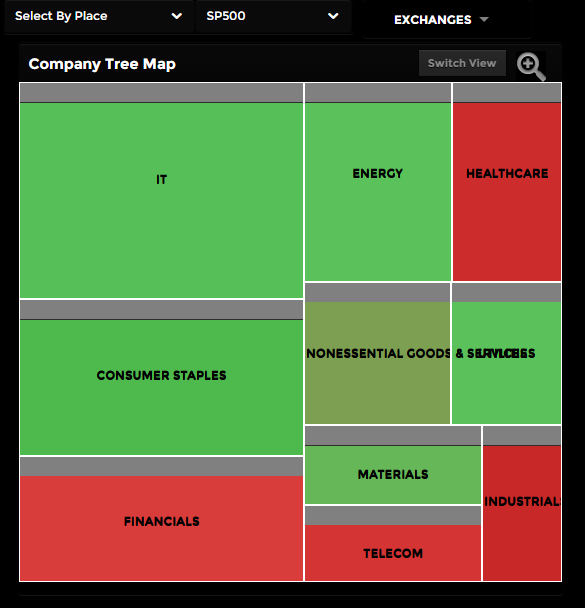
3. Analytics
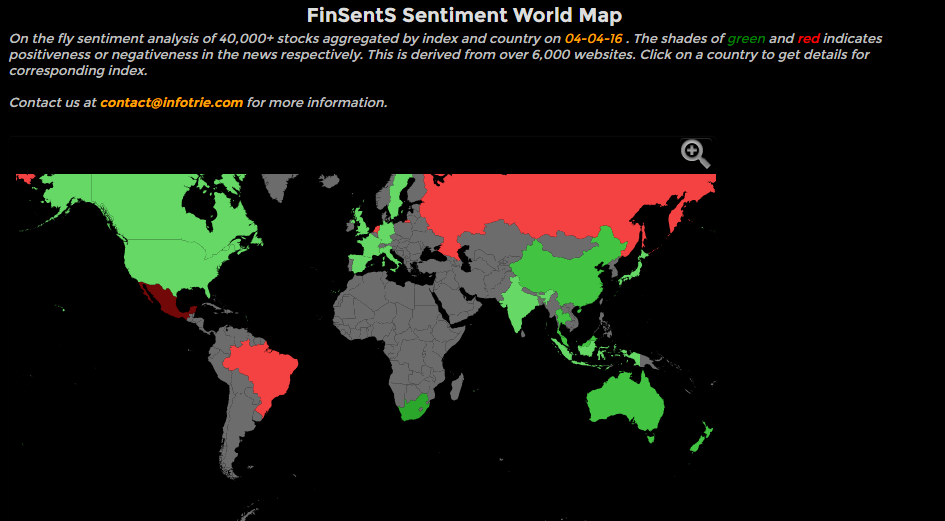
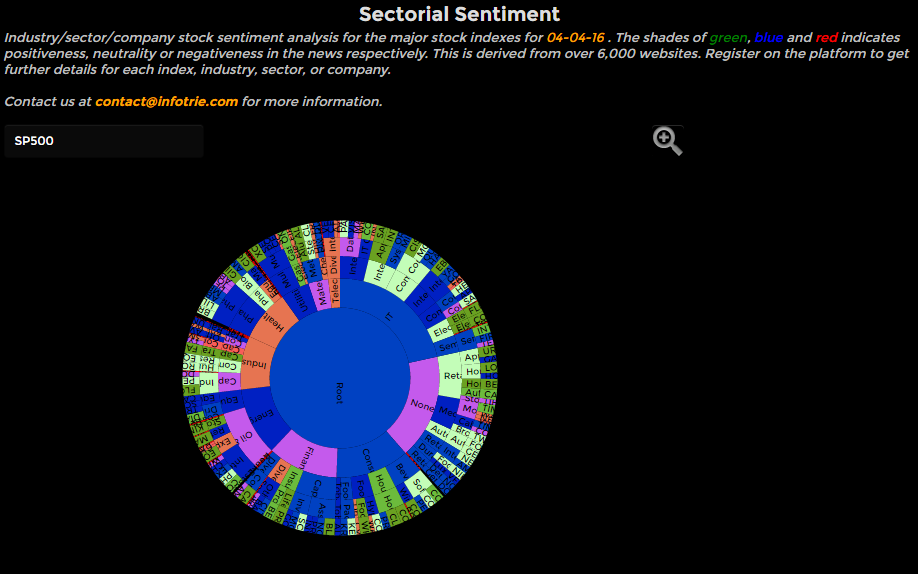
Analytics menu is setting for enhancing visualization of sentiment. There are three different representations: Company Tree map, Pie Chart and World Map. FinSentS uses three colors to show Positive, Neutral and Negative.
Tree map
World Map
Pie Chart
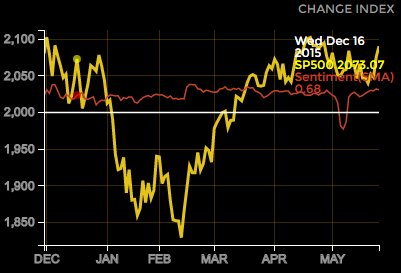
Sentiment Index
The sentiment index graph allows you to monitor the pulse of the market or portfolio. It represents the average sentiment of the group of assets that you are following.
Our Sentiment is being calculated on daily basis, on a scale from -5 to 5.
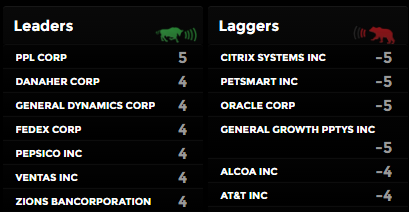
Leaders and Laggers
The leaders and laggers lists allow you to see the daily positive and negative sentiment scores and provide the direct link access to your interest.
0: There is no source of information available
-5: Minimum sentiment score means “Highly negative sentiment”
-1: Average sentiment score could mean “Neutral sentiment”
5: Maximum sentiment score can be considered as or means “Highly Positive sentiment”
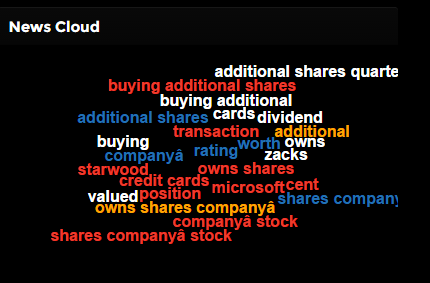
News Cloud
News Tags show the popular tags on Internet. It reflects a trend: the most important discuss that is occurring in the financial news. You can see related news by clicking these words.
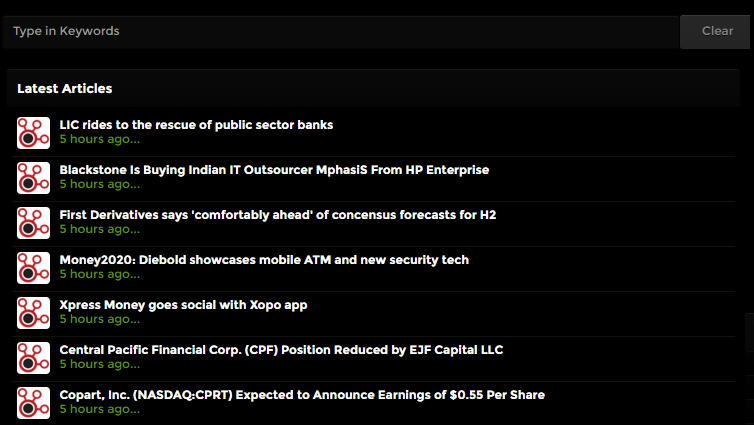
Articles
The articles box will allow you to follow the financial news activities on real-time basis.
The 2 different boxes are filtering the financial news per type of information sources:
- Articles Box refers to the web based financial news (Whole list available from Sources Menu)
- Tweet Box refers to the social media Tweeter
If the above content didn't answer your question, or have any comments please feel free to contact us support@infotrie.com, or send feedback